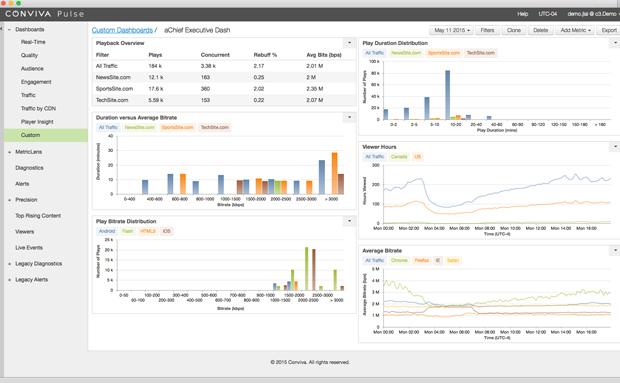
According to evidence from video optimisation firm Conviva, viewers are increasingly impatient when QoE (Quality of Experience) deteriorates and ever more likely to vote with their feet. “Everything we see tells us that [QoE] has a very direct and quantifiable impact on engagement, and engagement subsequently has a very direct correlation to the financial stability of a service,†says Conviva’s VP of Marketing, Simon Jones.
Sony Crackle, the digital network owned by Sony Pictures, found that deployment of Conviva’s Precision platform led to an 82% improvement in the buffering ratio (the percentage of total viewing time that a viewer sees the ‘spinning wheel’), plus a 49.6% increase in the average bit-rate. Together, these network-level improvements led to a 2-8 minute increase in time watched per viewer – a significant rise in user engagement.
There is a strong argument that improved network operations and QoE can boost content consumption and ultimately monetization. David Mowrey, Vice President of Product Management at Clearleap, the multiscreen platform provider that is now part of IBM, puts it bluntly: “The network behaviour drives user viewing consumption…If you don’t have Quality of Service, you’re not going to have viewing.â€
Peter Docherty, Founder and Chief Technology Officer at ThinkAnalytics, whose content recommendations engine is widely deployed with Pay TV customers, comments: “From an overall end-to-end churn perspective, if your picture keeps on breaking up then you can’t watch your service, so that is going to annoy you, which could then lead to a churn problem. Quality of Service data is obviously important from that perspective.â€
Alex Phillips, Senior Managing Consultant in the Communication Practice at IBM’s Global Business Services Division, observes that “telecoms companies have been quite advanced in this space in terms of putting probes into the network to carefully monitor in real-time the traffic that’s moving across the network. If your network gives you access to more actionable data, you can improve your network planning and Quality of Experience and lead to better customer engagement.â€
As part of an enterprise-wide data analytics strategy, a Pay TV operator can combine this network layer data – measuring the flow of bits sent over cable or fibre or through routers – with viewing and behavioural data from set-top boxes and servers, to achieve an extra level of insight.
Andy Aftelak, Vice President and Director in Advanced Technology at ARRIS, cites network DVR usage behaviour as an example, which demonstrates cyclical peaks based on when during the week the most popular shows are recorded. Such data is “invaluable†for network planners trying to compute the storage and networking resources required to optimise customers’ Quality of Experience (QoE), he points out.
“You can pin-point when a problem is happening, or indeed recognise a pattern of behaviour so that you can become more predictive in the way you look for a drop in the Quality of Service,†Aftelak explains.
ABI Research, the technology market intelligence company, has conducted research showing that new QoE products are coming to market which attempt to mine this combination of viewing and network-level data, for instance when a customer stops viewing mid-stream at the same time as a capacity ‘crunch’.
Simply knowing whether this happened in the operator’s network or in the customer’s own Wi-Fi setup is valuable in itself, since the information can be used to streamline call-centre responses, Eric Abbruzzese, Research Analyst at ABI Research, notes.
Meanwhile, if the delivery network turns out to be responsible, “you can get data such as ‘how long did the buffering event last?’ ‘Did they quit immediately?’ ‘What percentage of users quit after five seconds of buffering, or ten seconds?’ That is where the viewing behaviour data comes into play.â€
Abbruzzese points out that where cloud infrastructure is available, “it is much easier to scale in real-time very quickly to account for those viewing behaviours. When the World Cup is on, you need a lot more infrastructure. You can do that very quickly and scale [up processing capacity], and then when the World Cup ends, you can scale it back down.†This not only optimises QoE but potentially minimises infrastructure CapEx.
More reading
This is an edited excerpt from Videonet’s latest report, ‘Boosting television prospects with enriched data analytics’, which investigates how media companies can use a combination of viewing data, better programme metadata and network performance statistics to super-charge their content marketing and monetization, and strengthen advertising. It investigates what a holistic, enterprise-wide data analytics strategy looks like, with insights from Channel 4, Sky Media, ABI Research, ARRIS, ThinkAnalytics, IBM Global Business Services Division, Clearleap and IMGROUP, among others.
You can download the report (free) here.


